Course Lessons
chapter 5 : Data Shape
1. Skewness
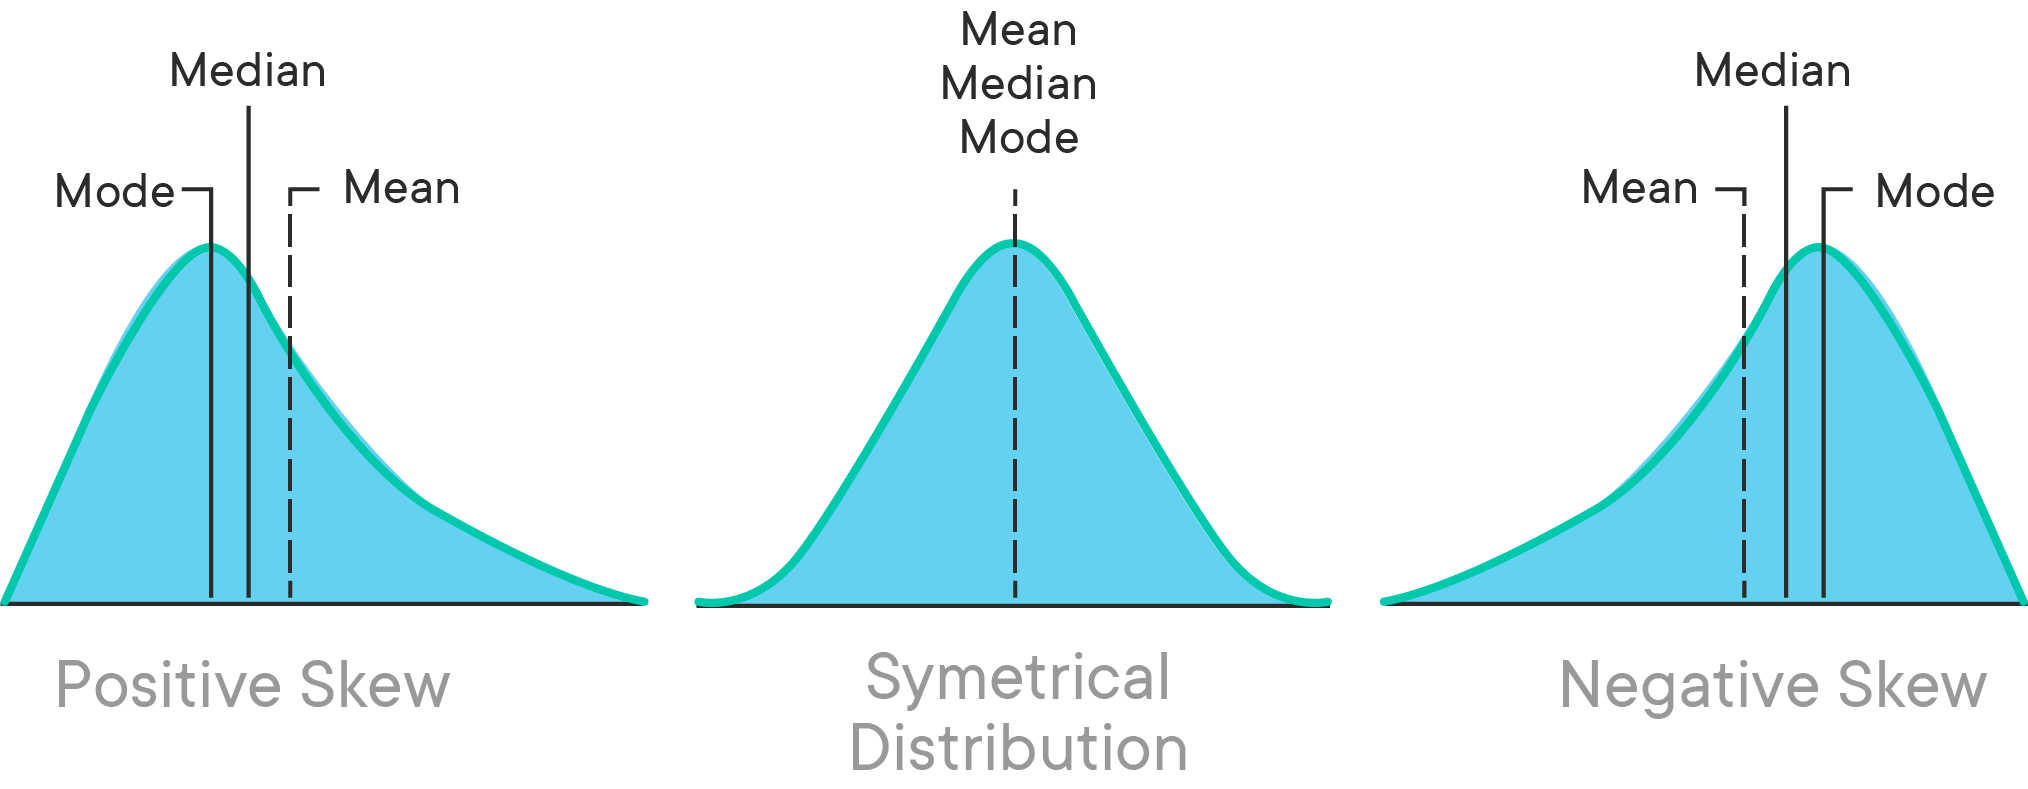
Skewness measures how asymmetric (uneven) a
distribution is around its average. It tells you whether the data values are
spread out more to one side (tail) than the other.
- Zero
skewness → distribution is symmetrical (balanced left and
right).
- Positive
skewness → right tail is longer (more small values, few large
ones).
- Negative
skewness → left tail is longer (more large values, few small
ones).
Simple Example:
Suppose test scores:
20, 30, 35, 40, 90
Most students have lower scores, and only one has a very high score → positive
skewness (tail on right).
Another set:
10, 60, 65, 70, 75
Only one low score → negative skewness (tail on left).
What it tells you: Skewness helps identify if extreme
values (outliers) are mostly on one end of the data.